

Strategy
How to plan Toronto Montreal Vancouver retention benchmarks
How to plan Toronto Montreal Vancouver retention benchmarks: compare agency scope, acquisition pressure and channel mix, then set targets from your own data.
What to take away
- Toronto Montreal Vancouver retention benchmarks are not published as a single set, so this guide sets out what to measure city by city and how to build targets from your own order data.
- Toronto carries the deepest agency bench and the highest retainers; Montreal is cheaper but bilingual creative and Bill 96 compliance add work; Vancouver sits between them with cross-border returns dragging on margin.
- Acquisition costs track local competition and ad auction density, not national averages, so a blended CAC misleads planners in all three cities.
- Email and SMS carry most Canadian retention revenue, but Montreal needs French-first messaging and Vancouver needs return-friendly flows.
- Set targets per city with a floor and ceiling, then test whether the gap between them is real or just noise.
Why city-level retention planning beats a single national benchmark
A national retention figure is an average of three different markets. Toronto, Montreal and Vancouver compete for different customers, pay different rents, and answer to different language rules. Planning to one number means one city subsidises another.
Statistics Canada publishes retail trade and ecommerce data broken out by province and selected census metropolitan areas, which is the closest thing to an official city-level baseline.
The table covering retail trade by kind of business and census metropolitan area lets you compare your own order volumes against the local retail picture rather than the country as a whole.
Statistics Canada reports retail sales, not repeat-purchase or retention rates, so treat those tables as a market-size check rather than a retention benchmark.
City-level retention planning also matters because the regulatory layer differs. Quebec's Charter of the French Language, strengthened by Bill 96, shapes commercial messaging in Montreal in ways that do not apply in Toronto or Vancouver. Canada's Anti-Spam Legislation applies everywhere, but the practical work of consent records and unsubscribe handling sits closer to the surface in a bilingual file.
There is a cost argument too. A retention programme run from one office with one agency and one creative library is cheaper to administer. It is also less likely to hit the local numbers, because the offer, the send time and the tone that work in Toronto may underperform in Montreal or Vancouver.
Treat the three cities as three plans that share a spine: same data model, same consent rules, same measurement, different targets and different creative.
Agency scope and retention talent across the three cities
Compare retention agency proposals on a like-for-like scope rather than treating the qualitative city rankings here as quoted rates. Toronto sits at the top. The city holds the largest concentration of retail head offices, DTC brands and specialist agencies, and senior retention talent commands salaries to match.
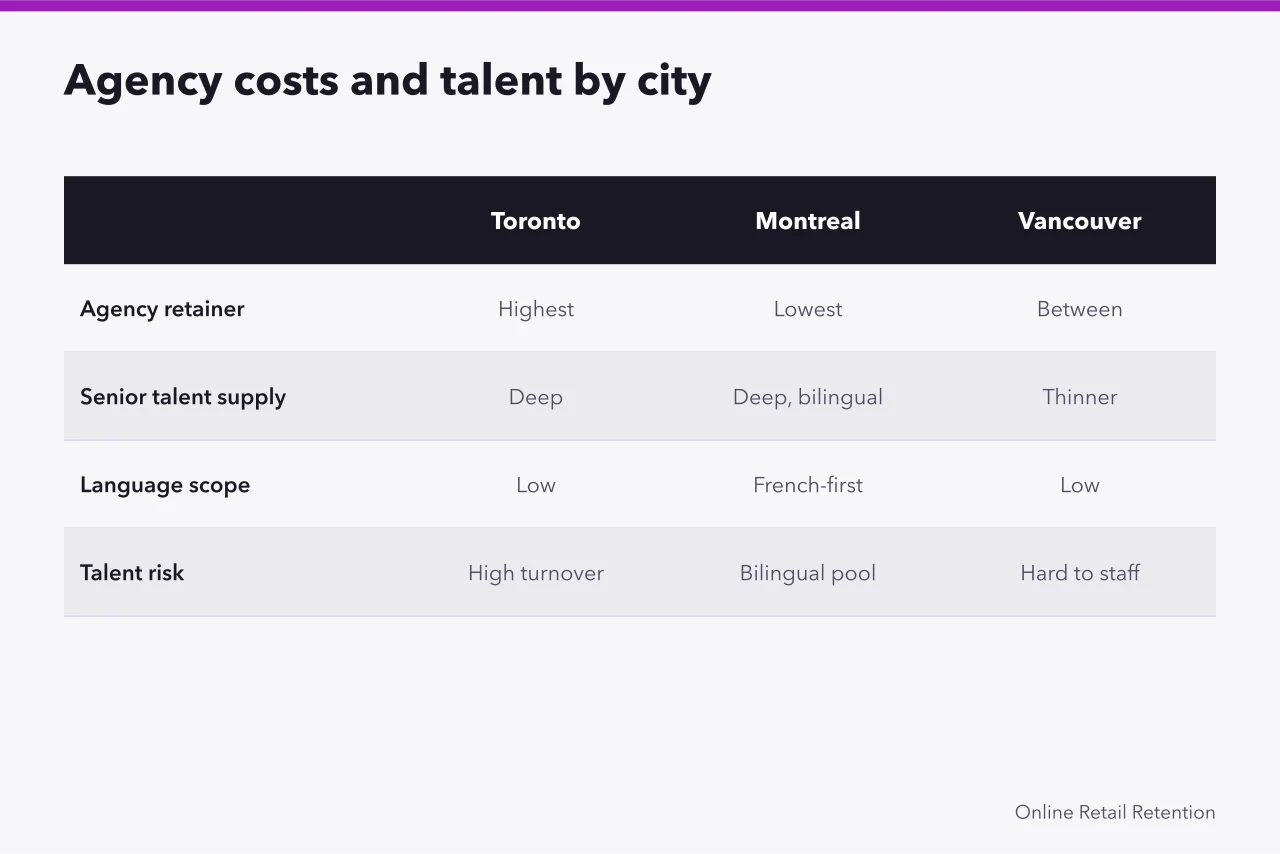
Montreal is the value market. Salaries and day rates run lower, and there is a deep pool of bilingual CRM and lifecycle marketers coming out of the gaming, telecom and travel sectors. The trade-off is scope: French creative, translation review and Bill 96 compliance are not optional extras, they are part of the retainer.
Vancouver sits between the two on cost and is the hardest of the three to staff for pure retention. The local talent pool skews toward brand, performance and marketplace work, and cross-border ecommerce experience is common while subscription retention experience is thinner.
When you compare proposals, ask each agency to price the same scope: audit, segmentation, lifecycle flows, SMS, reporting. If you are weighing shops, a tooling decision guide helps you score a paid diagnostic before you sign a retainer.
Talent also moves. A Toronto retainer that assumes a named strategist will stay on your account for two years is a risk. Build continuity into the contract, not the pitch.
For Montreal, confirm that the agency can produce French-first copy in-house rather than routing it through a translation vendor. That single question changes the cost line more than any rate negotiation.
Customer acquisition cost differences across the three cities
Customer acquisition cost is a local number wearing a national label. Paid social and search auctions price against the advertisers bidding in the same market, and the density of bidders differs sharply between the three cities.
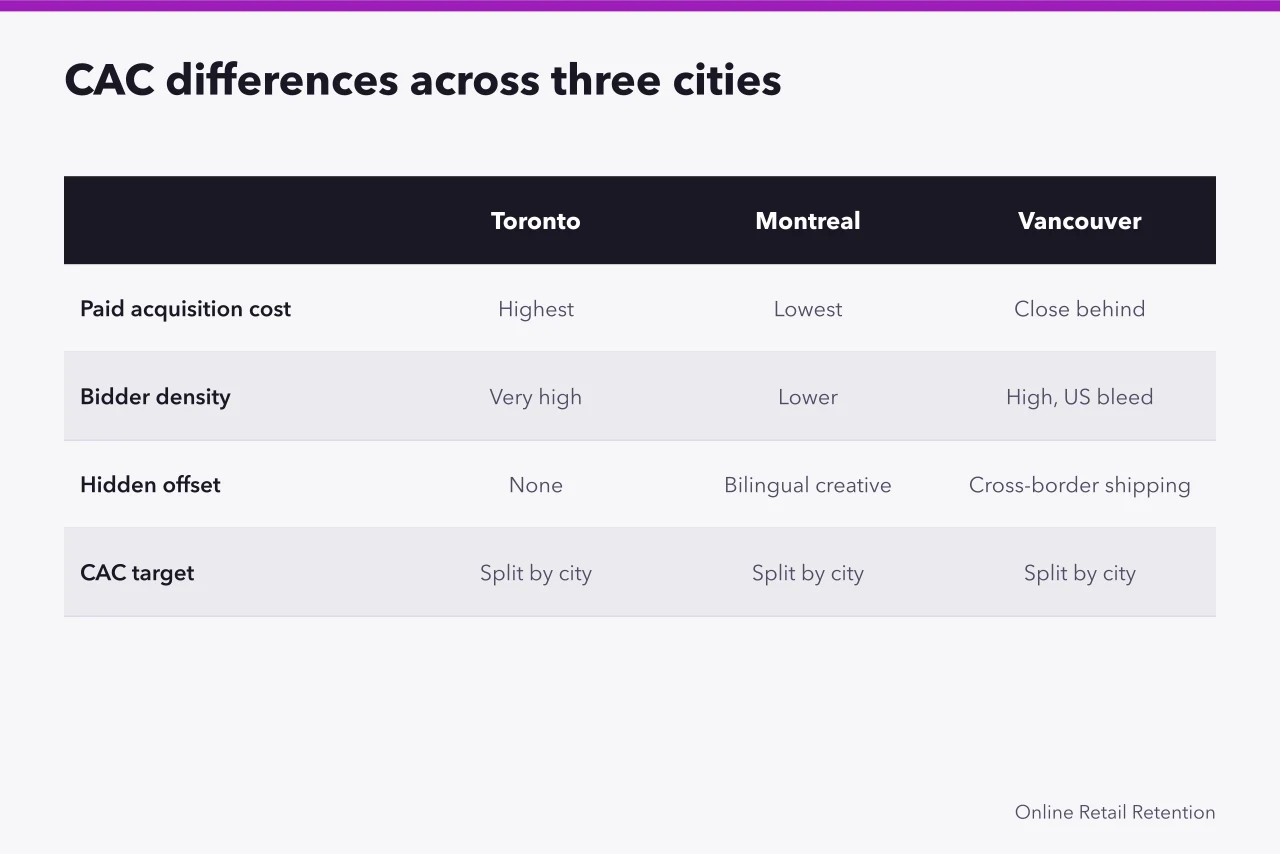
Toronto is the most expensive of the three for paid acquisition. Retail, financial services, telecom and a dense startup scene all bid for the same attention. Vancouver is close behind on paid social, partly because US advertisers bleed into the same auctions, and cross-border shipping expectations raise the effective cost of a first order.
Montreal is usually the cheapest of the three on paid media, but the saving is partly offset by the cost of bilingual creative and the smaller addressable audience for English-only campaigns. A cheap click that lands on English copy in a French-first market is not cheap.
The practical consequence is that a blended CAC target rewards whoever is running the cheapest city and punishes the team in the most expensive one. Split the target by city and hold each to its own number.
Official data helps you sanity-check the trend rather than the level. Statistics Canada's quarterly financial statistics for enterprises give a retail trade read that includes ecommerce movement, useful when you need to explain why a quarter moved. The release on quarterly financial statistics for enterprises is a reasonable reference point for that conversation.
If you want the underlying mechanics of payback, the method in customer lifetime value for a Canadian ecommerce business is worth applying per city rather than once for the whole account.
A worked example
Suppose a retailer sells a $120 product with a 35% gross margin, so $42 of gross profit per first order. Blended CAC is $38. Payback looks tight but survivable.
Split the same illustration by city: Toronto at $52, Montreal at $31, Vancouver at $44. Toronto loses money on the first order and only works if the customer returns within two purchase cycles. Montreal pays back immediately. Vancouver sits on the edge.
A single national CAC target of $38 would have told the Toronto team it was failing and the Montreal team it was fine. Neither signal is useful. The city-level view says: cut Toronto prospecting spend, shift budget to Montreal, and fix Vancouver returns before scaling there.
Channel mix: email, SMS and social in each market
Email remains the workhorse in all three cities, but the mix around it changes.
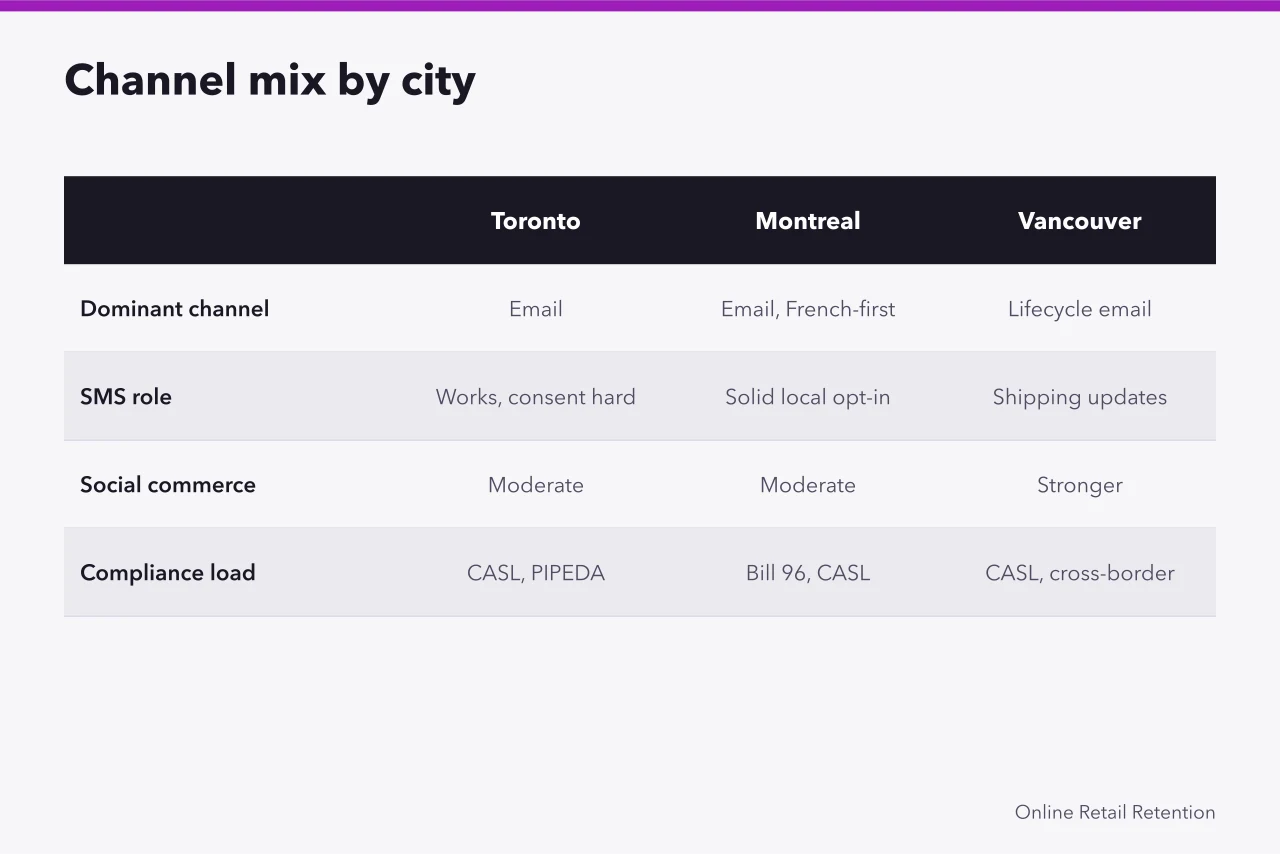
In Toronto, the file is large and the competition for inbox attention is intense. Sending frequency is higher, list fatigue arrives sooner, and segmentation earns its keep. SMS works but consent capture is harder because consumers are already on many lists.
In Montreal, email and SMS both need French-first treatment. Quebec's language rules affect commercial messaging, so a campaign built in English and translated afterwards reads like a translation. Build French first, then adapt to English. SMS opt-in rates tend to be solid where the offer is local and the copy is native.
In Vancouver, the mix leans harder on lifecycle email tied to shipping and returns, because a large share of orders cross the border. Return notifications, customs updates and delivery exceptions are retention messages, not logistics noise. Social commerce is stronger here than in the other two cities.
Across all three, the consent and unsubscribe machinery is governed by Canada's Anti-Spam Legislation, and privacy handling sits under PIPEDA and the Office of the Privacy Commissioner of Canada. Provincial consumer protection rules, such as Ontario's Consumer Protection Act, shape refund and cancellation language.
If you are choosing tooling, a platform comparison is a useful filter before you commit a city plan to a platform.
Channel mix at a glance
Primary retention channel
- Toronto
- Email, high frequency
- Montreal
- Email, French-first
- Vancouver
- Lifecycle email tied to shipping
Secondary
- Toronto
- SMS
- Montreal
- SMS
- Vancouver
- SMS, social
Watch item
- Toronto
- List fatigue, rising send costs
- Montreal
- Bill 96 compliance, translation quality
- Vancouver
- Cross-border returns and customs messaging
Qualitative planning map for the three cities
The table below summarizes relative planning considerations, not numerical retention benchmarks or quoted agency rates. Use it to decide what to investigate, then build targets from your own order, cost and repeat-purchase data after two full quarters.
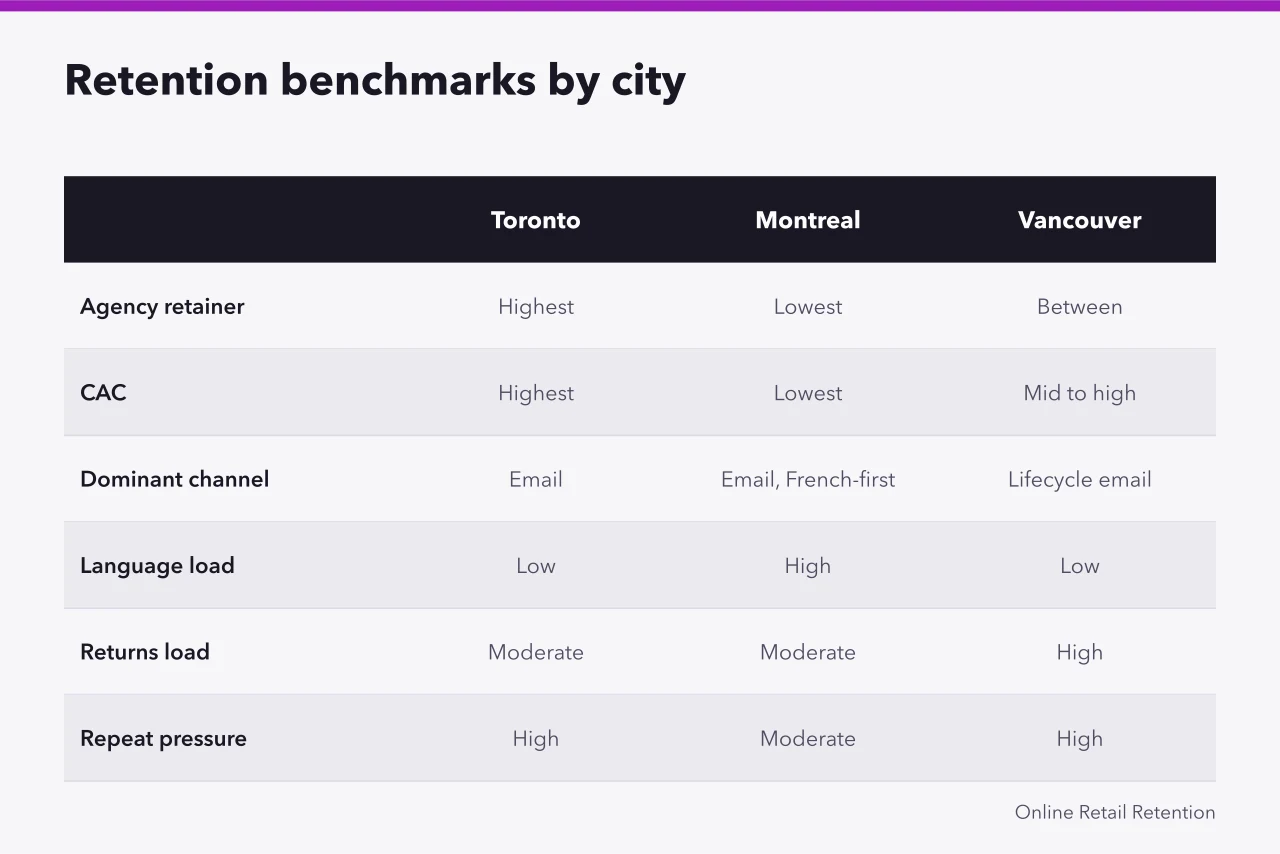
Retention benchmarks table
| Metric | Toronto | Montreal | Vancouver |
|---|---|---|---|
| Agency retainer, mid-market | Highest of the three | Lowest of the three | Between the two |
| Senior retention talent supply | Deep | Deep and bilingual | Thinner |
| Customer acquisition cost | Highest | Lowest | Mid to high |
| Dominant retention channel | Email, French-first | Lifecycle email | |
| Language compliance load | Low | High | Low |
| Returns and cross-border load | Moderate | Moderate | High |
| Repeat purchase pressure | High | Moderate | High |
Read the table as a relative map. The absolute numbers depend on category, price point and how long you have been collecting consent.
For a broader planning frame, ecommerce marketing strategy examples offers another way to organize the work. Keep that strategy separate from the city-level targets you calculate from your own orders.
Official digital economy statistics from Statistics Canada are the neutral reference when you need to argue that a local dip is market-wide rather than self-inflicted. The digital economy and society statistics collection is the place to start.
How to set city-level retention targets without overfitting
Overfitting happens when you build a target around one good month in one city. The fix is a floor, a target and a ceiling, with a rule for what counts as a real move.
Set city-level retention targets
- Pull 24 months of orders by city and split first-time from repeat buyers.
- Set the floor at your worst credible quarter and the ceiling at your best, then set the target at the midpoint.
- Define the minimum change that matters, for example two percentage points on repeat rate, and ignore anything smaller.
- Assign one owner per city so accountability is not shared across a national team.
- Review quarterly, and only reset a target when two consecutive quarters move the same way.
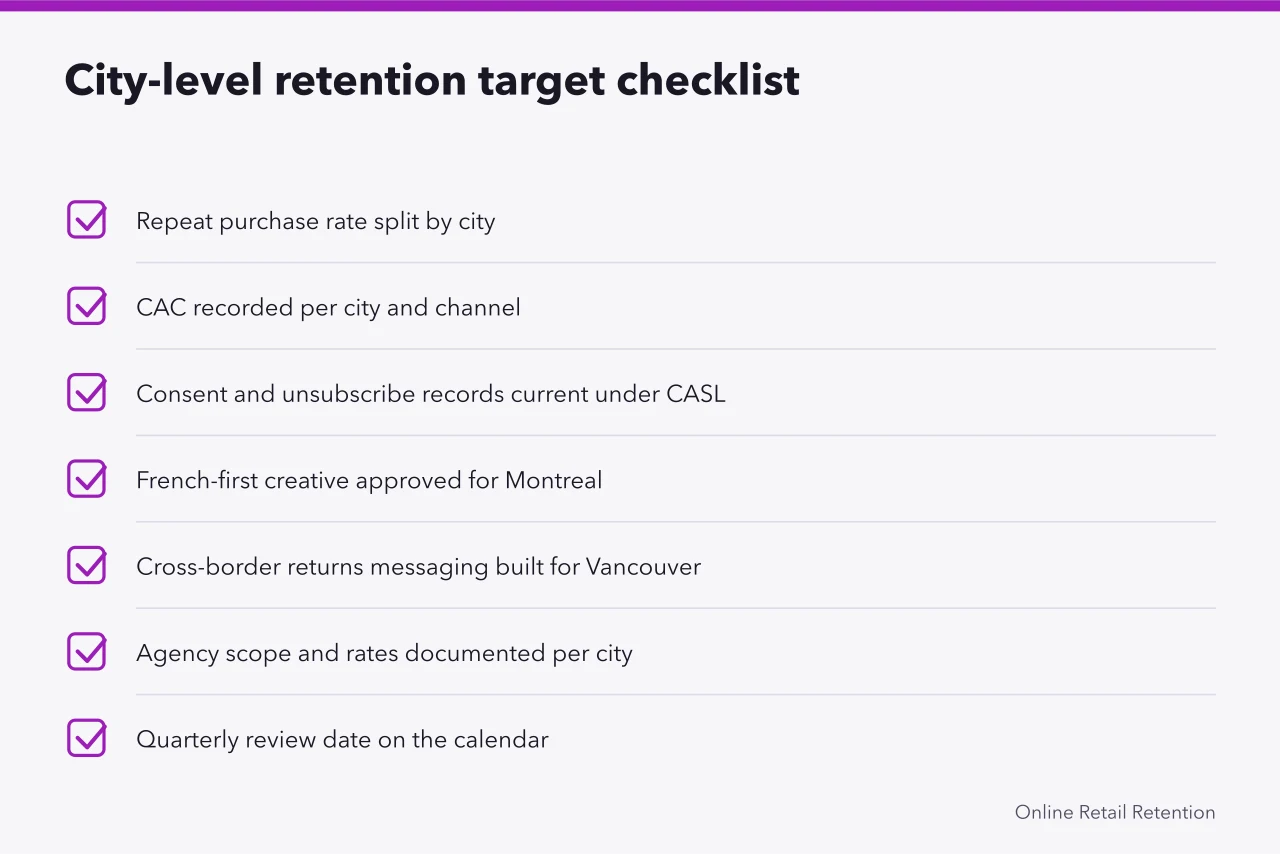
- Repeat purchase rate split by city, not blended
- CAC recorded per city and per channel
- Consent and unsubscribe records current under CASL
- French-first creative approved for Montreal
- Cross-border returns messaging built for Vancouver
- Agency scope and rates documented per city
- Quarterly review date on the calendar
Two provincial resources are worth bookmarking. Quebec's enterprise register lets you verify the legal entity behind a Montreal brand before you sign anything, through the Quebec enterprise register search.
In British Columbia, the province's small business resources cover registration and operating support that applies to ecommerce retention operations based there.
Keep the plan boring. Three cities, three targets, one measurement standard, and a review cadence that survives a bad quarter.